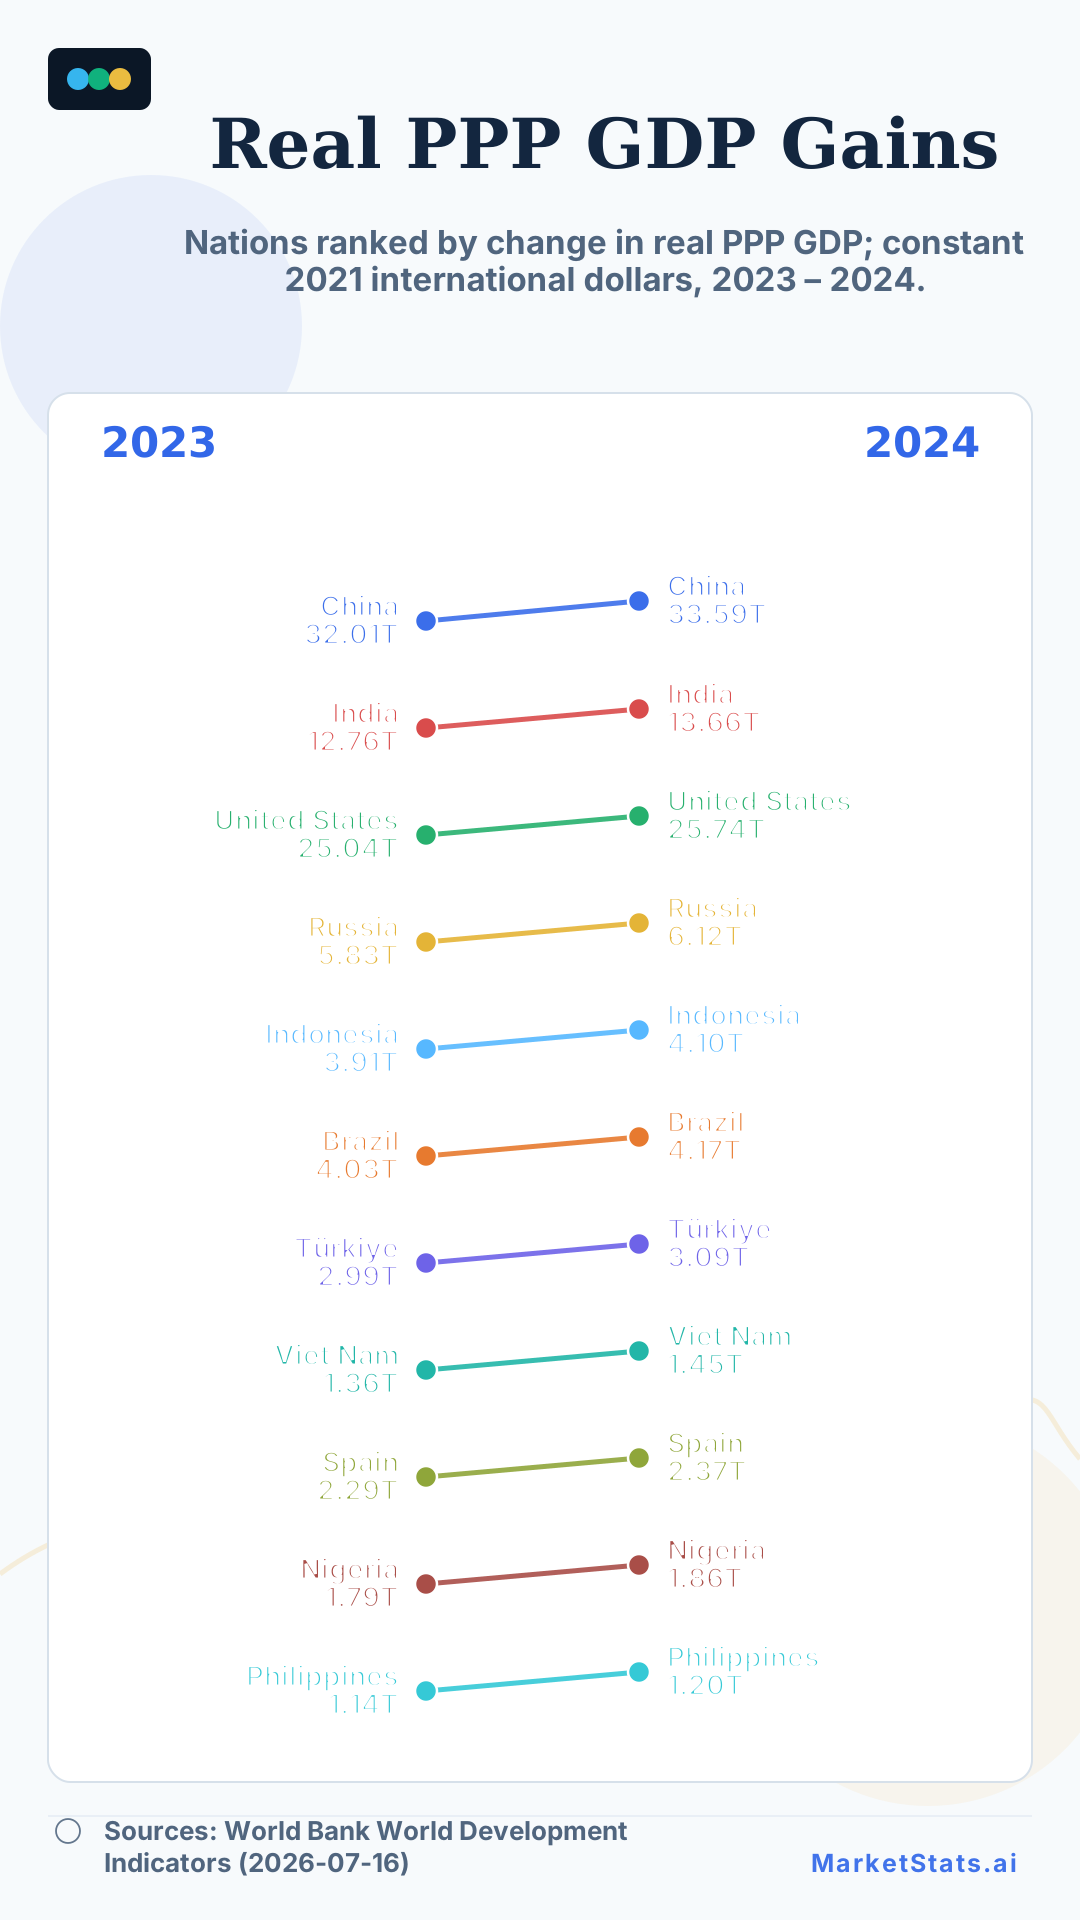
Largest Real PPP GDP Gains by Nation, 2023–2024

Nations ranked by change in real PPP GDP; constant 2021 international dollars, 2023–2024.

What the Data Shows

This comparison ranks nations with values in both periods by the increase in real PPP GDP from 2023 to 2024. It retains 185 comparable nation rows with published values in both years, measured in constant 2021 international dollars. China ranks first at +PPP$1.59T, moving from PPP$32.01T to PPP$33.59T. India is second at +PPP$905.6B, followed by United States at +PPP$699.4B; two annual endpoints do not establish a long-run trend.

Data table

China — 2023 32.01T +1.59T
China — 2024 33.59T +1.59T
India — 2023 12.76T +905.6B
India — 2024 13.66T +905.6B
United States — 2023 25.04T +699.4B
United States — 2024 25.74T +699.4B
Russia — 2023 5.83T +287.2B
Russia — 2024 6.12T +287.2B
Indonesia — 2023 3.91T +196.6B
Indonesia — 2024 4.10T +196.6B
Brazil — 2023 4.03T +137.7B
Brazil — 2024 4.17T +137.7B
Türkiye — 2023 2.99T +99.6B
Türkiye — 2024 3.09T +99.6B
Viet Nam — 2023 1.36T +95.6B
Viet Nam — 2024 1.45T +95.6B
Spain — 2023 2.29T +79.1B
Spain — 2024 2.37T +79.1B
Nigeria — 2023 1.79T +72.8B
Nigeria — 2024 1.86T +72.8B
Philippines — 2023 1.14T +65.0B
Philippines — 2024 1.20T +65.0B

Data notes & caveats

The source value uses constant 2021 international dollars. The comparison is based on two annual observations and should not be read as a long-run trend.

Methodology

The comparison uses sovereign-nation observations for GDP, PPP (constant 2021 international dollars) from World Bank World Development Indicators. Rows with values in both 2023 and 2024 are retained, and the change equals the later value minus the earlier value. World Bank aggregates and non-sovereign territories are excluded, and rows are ordered by the signed change.

Source consistency notes

Every row uses the same World Bank indicator, two annual periods, entity definition and measurement unit.

Licensing

Branded MarketStats graphics are free to use*

Keep the visible MarketStats attribution, source line and canonical page link intact. For clean unbranded assets, commercial use or higher-volume reuse, choose one of the licensing tiers below.

View tiers and terms
Request unbranded access

This specific graphic needs a source-rights review before an unbranded download. Branded use remains available.

* Free branded use is subject to the Terms and requires attribution/canonical-link preservation. MarketStats licenses the graphic presentation and MarketStats-created editorial layer, not the underlying third-party source data. Source attribution and source-provider obligations still apply.